

UV-Vis Spectroscopy
Ultraviolet-visible (UV-Vis) spectroscopy is a multiresponse technique that analyzes the evolution of the absorption spectra in UV-Vis regions during an electrode process. This technique provides information from an electrochemical and spectroscopic point of view. In this way, it enables a better perception about the chemical system of interest. On one hand, molecular information related to the electronic levels of the molecules is obtained from the evolution of the spectra. On the other hand, kinetic and thermodynamic information of the processes is obtained from the electrochemical signal. Ultraviolet-visible (UV-Vis) spectroscoy is a multiresponse technique that analyzes the evolution of the absorption spectra in UV-Vis regions during an electrode process. This technique provides information from an electrochemical and spectroscopic point of view. In this way, it enables a better perception about the chemical system of interest. On one hand, molecular information related to the electronic levels of the molecules is obtained from the evolution of the spectra. On the other hand, kinetic and thermodynamic information of the processes is obtained from the electrochemical signal.
UV-Vis spectrophotometer is a powerful analytical technique to determine the optical properties (transmittance and absorbance). It is generally used to determine analyte concentrations or the chemical conversion of a component in solution, and measure the transmittance of a solid sample.
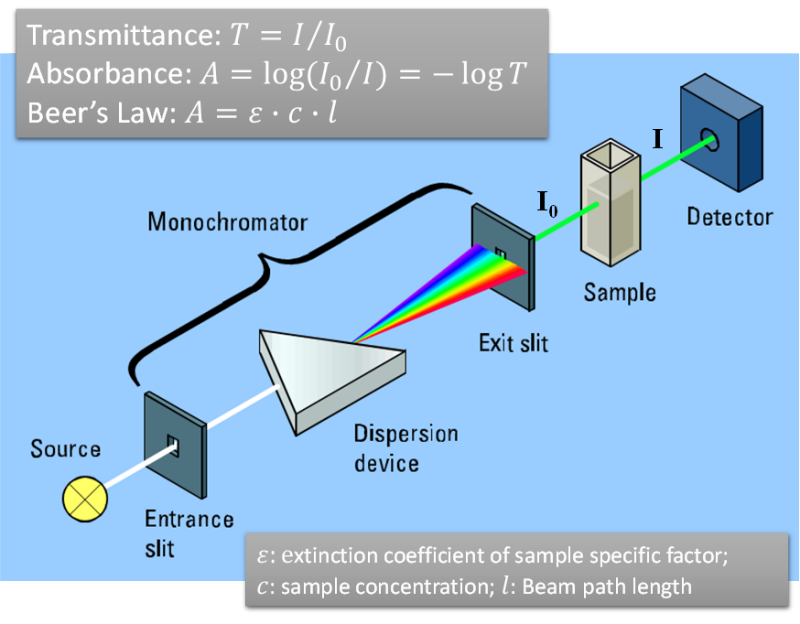
Many molecules absorb ultraviolet or visible light. Absorption may be presented as transmittance (T) or absorbance (A). The absorbance of a solution increases as attenuation of the beam increases. Absorbance is directly proportional to the path length and the concentration of the absorbing species (Beer's Law). Different molecules absorb radiation of different wavelengths. An absorption spectrum will show a number of absorption bands corresponding to structural groups within the molecule.
APPLICATIONS
- Determination of the optical properties of liquids and solids
- Quantification of analytes in solutions
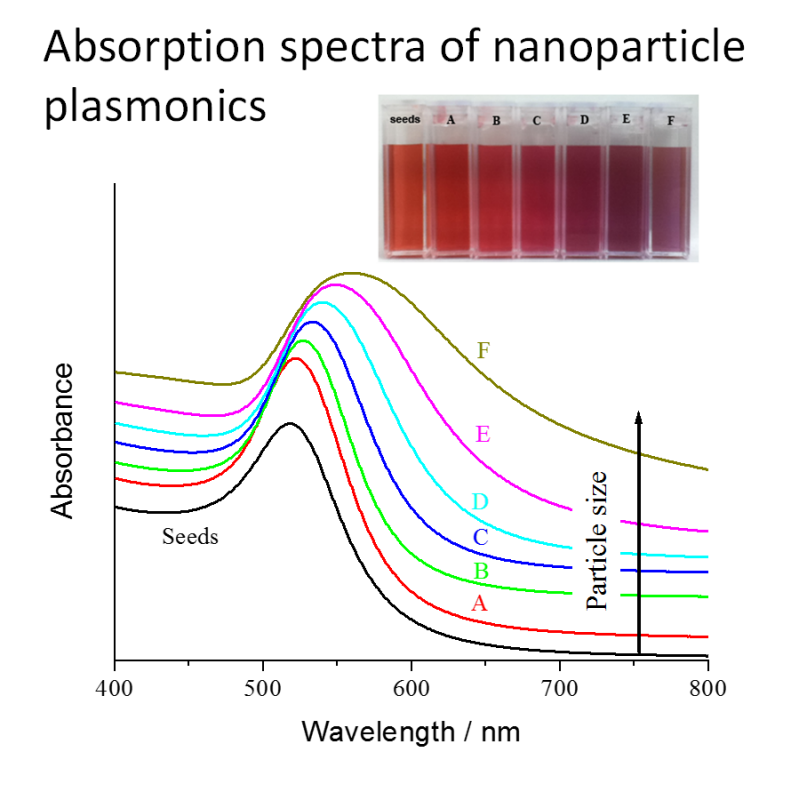
- Gold nanoparticle size/shape identification
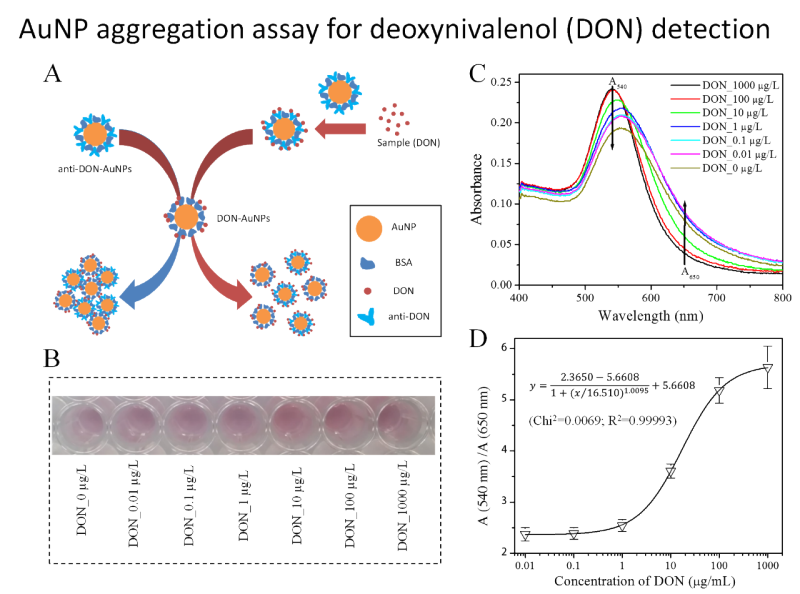
- Colorimetric analysis
LIMITATIONS
- Other components in solution may cause interferences
- Chromatographic analysis methods are more accurate and precise than UV/VIS/NIR methods
- Sample size / sample volume have specific requirements (see technical specifications)
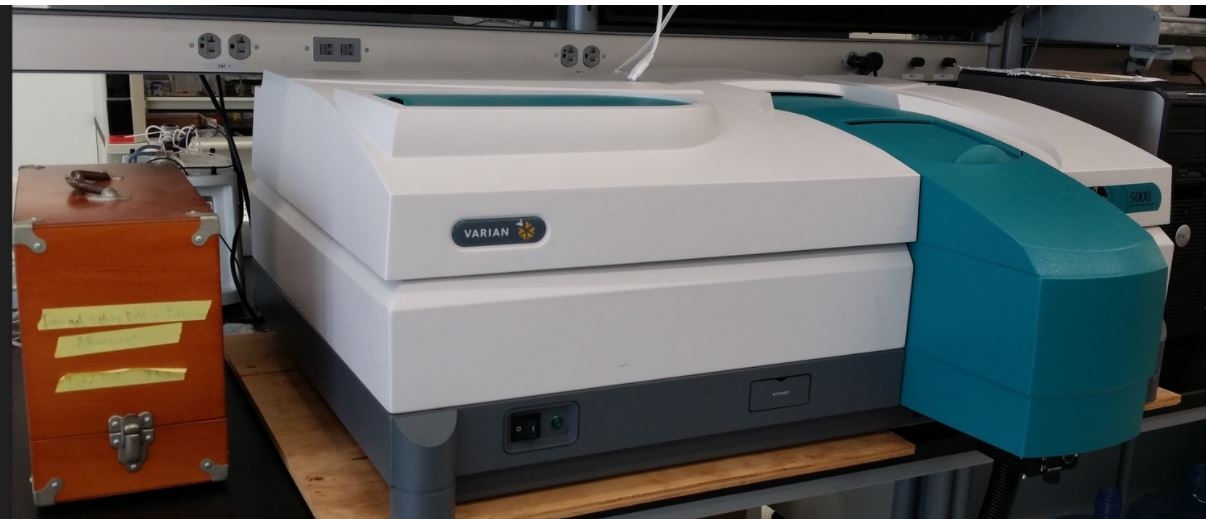
Cary 5000 UV-Vis-NIR Spectrophotometer
The Cary 5000 is a high performance UV-Vis-NIR spectrophotometer with super photometric detection in the 175-3300 nm range. The system can perform absorption, transmission and diffusion reflectance scans depending on the sample status. A multi-sample holder with temperature controlling is convenient for any dynamic analysis.
TECHNICAL SPECIFICATIONS
- Wavelength range: 175-3300 nm (175-2500 nm when using the integrating sphere)
- Maximum scanning speed: 2,000 nm/min (UV-Vis), 8,000 nm/min (NIR)
- Sample size: between 0.5 cm × 0.5 cm and 10 cm × 10 cm for solid samples
- Sample volume: > 0.2 ml for liquid samples
External Highlight: Pacific Northwest National Laboratory (Kenton Rod, PI)
Water-dispersible nanocolloids and higher temperatures promote the release of carbon from riparian soil: The objective of this research was to investigate the influence of temperature increases on the fate of OC in riparian sediments from alpine regions undergoing glacial retreat. Laboratory‐based batch vessels and flow‐through columns were set up to allow for geochemical reactions involving synthetic riparian groundwater and Nisqually River sediment (Mt. Rainier National Park, USA, where glaciers are retreating) to investigate temperature change influences on the simultaneous release of OC and colloids. To amplify the potential nanocolloid–OC interaction, half of the reacted sediments were amended with illite clay, a two‐dimensional nanomineral. The mineral association and transport of OC via riparian water through these sediments were examined at 4 °C (a typical temperature of these waters in their field setting). Further, to perturb the system such that a measurable change in biogeochemistry could be observed, a parallel laboratory setup was used at standard temperature (20 °C). These temperatures are within the range of historic soil temperatures measured at Mt. Rainier. Subsequently, a mathematical model was developed to explore factors controlling OC release from these sediments.
Publication
- Rod, K. A., Smith, A. P., Leng, W., Colby, S., Kukkadapu, R. K., Bowden, M., Qafoku, O., Um, W., Hochella, M. F., Jr., Bailey, V. L., and Renslow, R. S. (2020). Water-dispersible nanocolloids and higher temperatures promote the release of carbon from riparian soil. Vadose Zone Journal, 19(1), e20077. https://doi.org/10.1002/vzj2.20077
Rod, K. A., Smith, A. P., Leng, W., Colby, S., Kukkadapu, R. K., Bowden, M., Qafoku, O., Um, W., Hochella, M. F., Jr., Bailey, V. L. and Renslow, R. S. (2020). Water-dispersible nanocolloids and higher temperatures promote the release of carbon from riparian soil. Vadose Zone Journal, 19(1), e20077. https://doi.org/10.1002/vzj2.20077
Coming soon...